Finance is a very hot industry in the Asia-Pacific region. As people looking for financial services, insurances, credits or investments search for information on the internet, their online behaviors are keys to understanding consumers trends. This dashboard will greatly help marketers of the financial industry in ASEAN and APAC.
The team of Think with Google Asia-Pacific created a set of tools to monitor Internet search data from Google on the banking and insurance industry for loans, insurances and investments, as it did for search trends of the travel industry in APAC.
These tools report data from the search engine in the 6 big ASEAN countries, Indonesia, Malaysia, Philippines, Singapore, Thailand, Vietnam, as well as Australia, Hong Kong, India and Japan.
Reading and analyzing finance trends in ASEAN (and Asia-Pacific)
The APAC financial dashboard regroups different interactive tools to analyze financial trends throughout the ASEAN-6 countries and APAC region, often allowing to select countries and/or industry and see the evolution through time. Note that the data is available from 2014 and notably misses information on China, as Google is only indirectly present there.
Search volume throughout the years
This first tool allows anyone to compare the evolution of volumes of search queries in each country for the following categories:
- auto loans
- general banking
- auto insurance
- credit cards
- health insurance
- home loans
- investing
- personal loans
This useful tool is a great means to understand general dynamics of these various financial services, seasonal trends or hot/cold categories in each country.
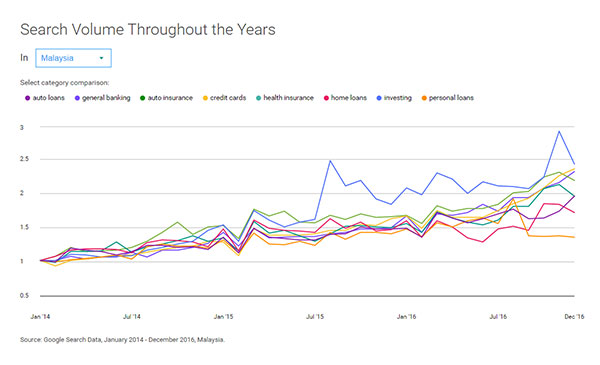
For example, in Malaysia:
- The high search volumes for investing shows a national interest for financial investments.
- The growing volumes throughout the categories show the continual growth of interests for all financial services.
- The trough in search for all categories shows that the period around february, corresponding to the Chinese New Year is not a good time for financial marketing.
Share of brand searches
The following tool shows the most important brands, banking and financial services companies in each country and how they compare to each other in terms of volume of search traffic. It is a great tool to compare the value of the different brands indexed together as well as year-on-year, allowing to assess the weight and dynamism of each company online.
Share of search volumes
One of the most useful tools, the share of search volumes helps to compare the volumes of each financial category, both indexed together and year-on-year. It is therefore critical to analyze for companies and understand where to focus their marketing efforts, either on the larger digital search markets or on their specific niche, depending on their specialties.
Mobile search volume across categories
This tool provides more insights into the behaviors and volumes of mobile users in search for financial services. They show the absolute volumes and relative importance of queries on mobile devices and year-on-year evolution related to banking, loans, insurances and investments.
It highlights how critical it is for financial services companies operating in certain categories to have a mobile friendly approach (or not) for their digital marketing. It also helps to tackle differences between countries in the digital approach through mobile or desktops
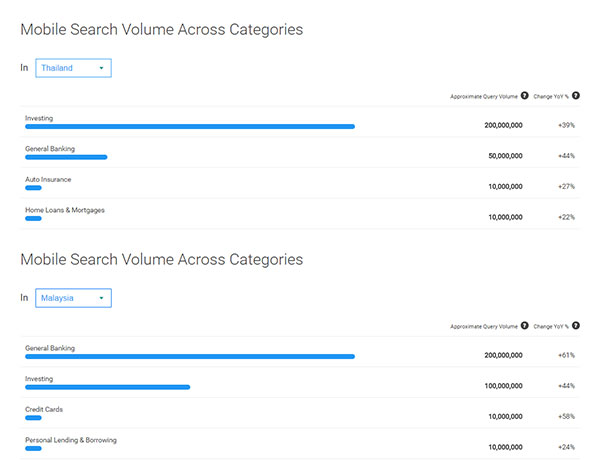
Thailand-Malaysia example:
Mobile search in Thailand are primarily focused on investing, while they are first based on general banking in Malaysia.
Top 10 comparison sites
This tool lists the major financial services comparison tools across the Asia Pacific region, with the relative volumes of each site and the evolution year-on-year.
Top 10 questions asked via smartphones
This last tool enables marketers to understand better the behaviors and interests of mobile searchers in each country. Confronted with the data from mobile search volumes across categories, it will help to discern which are the converting queries and requests, and which ones are purely informational.
Image captures from Think with Google’s APAC financial dashboard


