
Recently opened to foreign business, Myanmar is emerging from decades of isolation to develop its economy and provide a better life to its relatively large population. This series of infographics presents key demographic and economic data of Myanmar, together with comparisons with other ASEAN and world-leading countries.
To help you grasp the dynamics of economics and business in Myanmar through visuals, here are 4 infographics on some of the country’s key data. They present information from the World Bank data from 2016 on the population, wealth and economy of Myanmar compared with other ASEAN countries and some major global markets and economies: US, EU, China, Japan and India.
To obtain further information on the Myanmar and Southeast Asian population, cities and urban population, check this other series of infographics on ASEAN demography, top cities and urbanization. For a broader view of ASEAN’s demography and economy, visit the infographics on ASEAN’s population, market and economy.
Feel free to use these infographics as needed for your presentations, websites, blogs, illustrations, etc. However, if you do so, please add a link back to this page to help spread this useful information and graphics. Thank you!
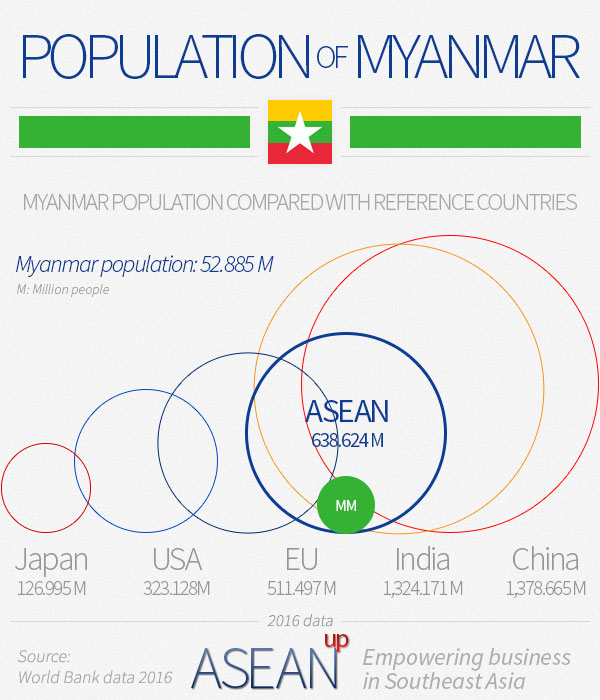
The population of Myanmar
This initial infographic compares the population of 52 million of Myanmar with ASEAN and other major global markets: the US, EU, China, Japan and India.
Comparison of the Burmese population with reference countries
Embed code
<a href='https://aseanup.com/myanmar-infographics-population-wealth-economy/'><img src='https://aseanup.com/wp-content/uploads/2018/02/myanmar-population.jpg' alt='Comparison of the Burnmese population with reference countries' width='600px' /></a>
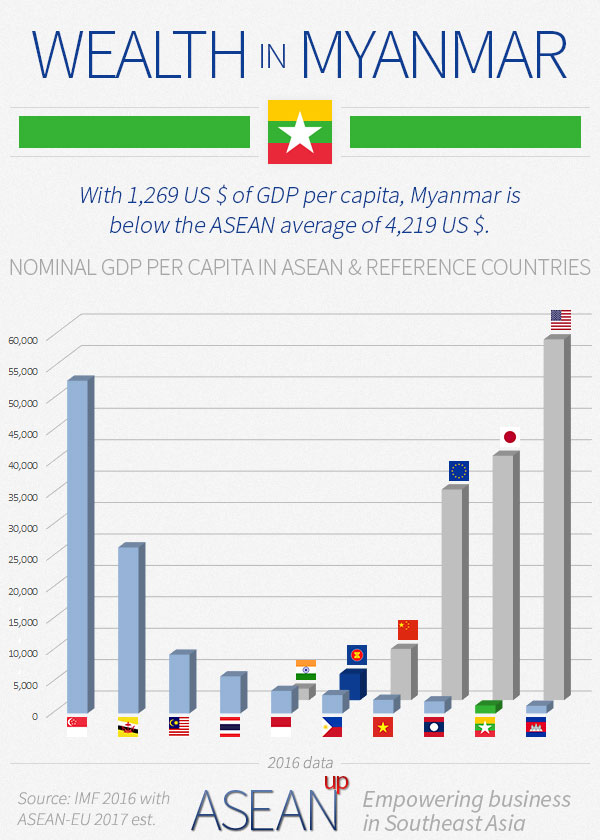
Wealth of the Burmese
The next graphic shows a comparison between the wealth of Myanmar’s people, expressed in nominal GDP per capita, with other ASEAN countries, ASEAN as a whole, as well as major regional and global powers: the US, EU, China, Japan and India.
Comparison of Myanmar’s GDP per capita with ASEAN and reference countries
Embed code
<a href='https://aseanup.com/myanmar-infographics-population-wealth-economy/'><img src='https://aseanup.com/wp-content/uploads/2018/02/myanmar-gdp-per-capita.jpg' alt='Comparison of Myanmar’s GDP per capita with ASEAN and reference countries' width='600px' /></a>
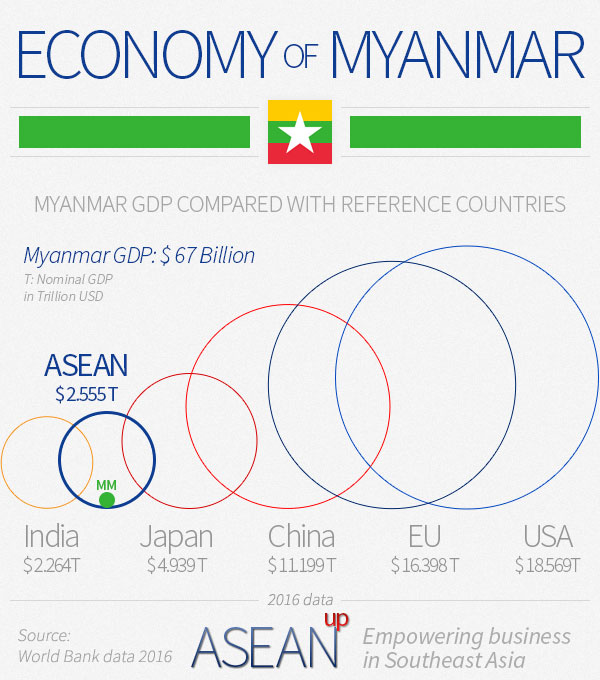
The Burmese economy
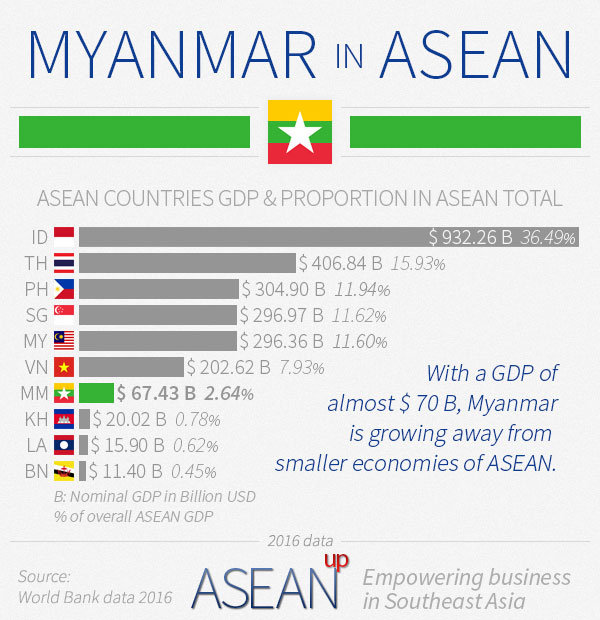
The two following infographics compare the US$ 67 Billion GDP of Myanmar with other countries. The first one with ASEAN and other major global markets: the US, EU, China, Japan and India; the second within ASEAN and its other 9 member countries.
Comparison of Myanmar’s economy with reference countries
Embed code
<a href='https://aseanup.com/myanmar-infographics-population-wealth-economy/'><img src='https://aseanup.com/wp-content/uploads/2018/02/myanmar-economy.jpg' alt='Comparison of Myanmar's economy with reference countries' width='600px' /></a>
Myanmar economy compared to other ASEAN countries
Embed code
<a href='https://aseanup.com/myanmar-infographics-population-wealth-economy/'><img src='https://aseanup.com/wp-content/uploads/2018/02/myanmar-economy-vs-asean-countries.jpg' alt='Myanmar’s economy compared to other ASEAN countries' width='600px' /></a>


