Malaysia is an attractive country for many investors thanks to its modern society, habits and tastes, fairly high income and consumption. With accurate numbers on its demography, geography, revenues and household expenditures, this overview of the Malaysian market will provide useful marketing insights.
One of the most developed countries of Southeast Asia, Malaysia is well on its way towards becoming a high income nation. It the country succeeds in implementing its ambitious economic plan it will soon become a developed country, raising even more business appetites.
For now, the following data on Malaysia’s population, income and consumption will help marketing minded people evaluate their opportunities in the country.
Demography of Malaysia
Malaysia has an estimated population of more than 31 million inhabitants (extrapolated from the 28.3 million counted in the 2010 census). Malaysians are now predominantly urban, with approximately 75% of Malaysians living in cities.
Geographic distribution of Malaysians
The country is subdivided into states and federal territories (Kuala Lumpur, Putrajaya and Labuan), with states of Peninsular Malaysia regrouping more than two third of the country’s population.
Largest urban areas of Malaysia
The country’s population is primarily regrouped in its largest cities and surrounding areas, both in Peninsular Malaysia and East Malaysia. The following infographic maps these urban areas with details on their population according to the 2010 census.
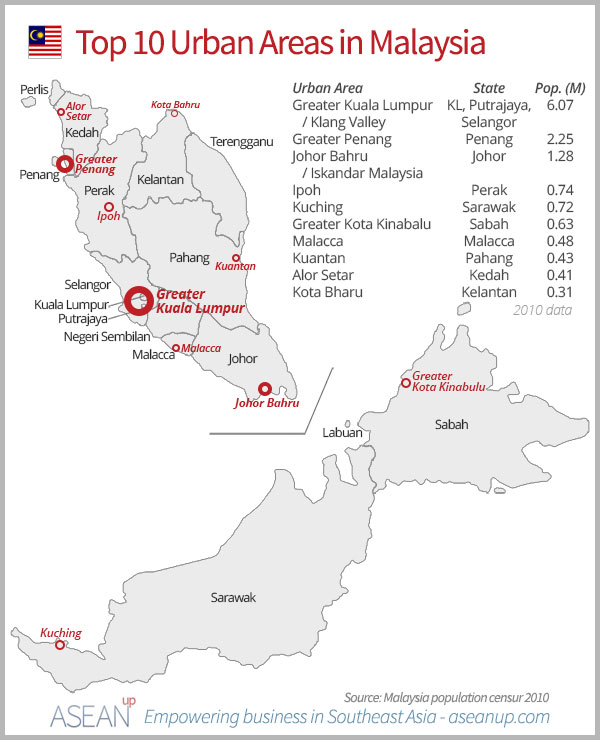
Here is the detail of these ten urban areas and their constituents’ population as of 2010.
- Greater Kuala Lumpur / Klang Valley: 6,071,644
- Kuala Lumpur: 1,588,750
- Petaling Jaya: 613,977
- Shah Alam: 641,306
- Selayang: 542,409
- Klang: 744,062
- Subang Jaya: 708,296
- Ampang Jaya: 468,961
- Kajang: 795,522
- Greater Penang: 2,251,072
- Penang Island: 708,127
- Seberang Perai: 818,197
- Sungai Petani: 443,488
- Kulim: 281,260
- Johor Bahru / Iskandar Malaysia: 1,277,244
- Johor Bahru: 497,067
- Johor Bahru Tengah: 529,074
- Pasir Gudang: 46,571
- Kulai: 234,532
- Ipoh: 737,861
- Ipoh: 657,892
- Batu Gajah: 79,969
- Kuching: 715,302
- Kuching North: 165,642
- Kuching South: 159,490
- Padawan: 273,485
- Samarahan: 116,685
- Greater Kota Kinabalu: 628,725
- Kota Kinabalu: 452,058
- Penampang: 176,667
- Malacca: 484,885
- Kuantan: 427,515
- Alor Setar: 405,523
- Kota Bharu: 314,964
Malaysian population density
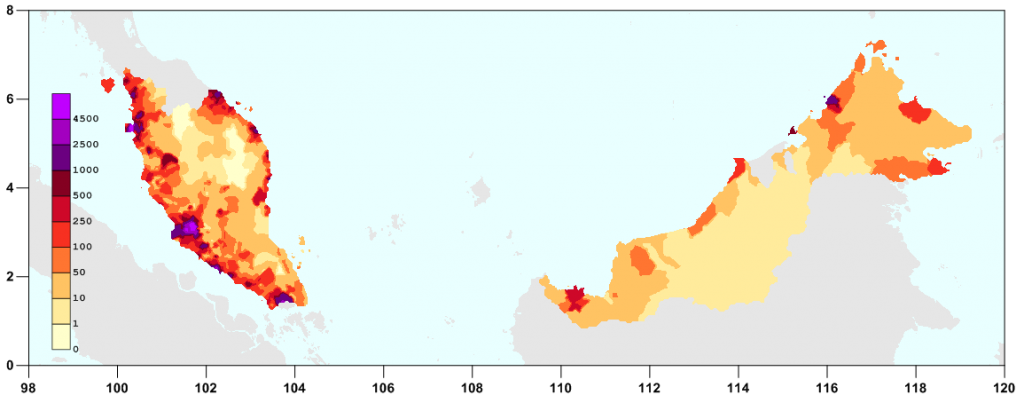
The distribution of the Malaysian population is highly uneven. The following density map show how the Malaysians are regrouped in Peninsular Malaysia and East Malaysia (Malaysian Borneo) and their concentration in and around cities.
Malaysian population structure
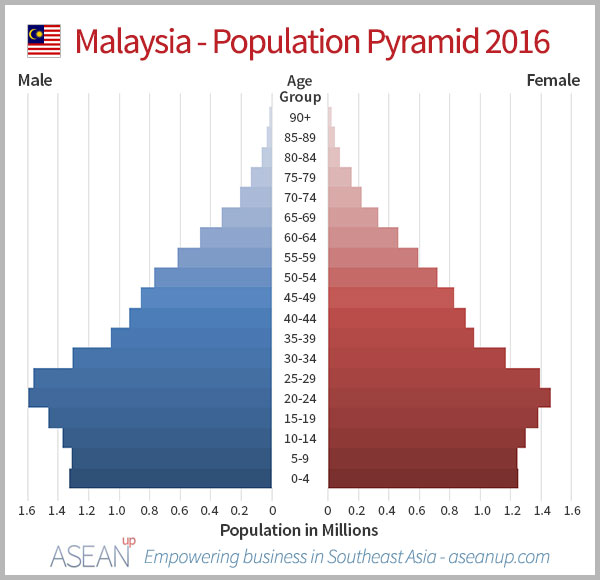
The distribution of the Malaysian population according to age and sex presents a slightly higher percentage of men with 107 males for 100 females. Also extrapolated from the 2010 census, the following data presents the structure of the Malaysian population as of July 2016.
Age and sex in Malaysia in 2016
| Age Group | Male | Female | Total | % |
|---|---|---|---|---|
| Total | 16 430 688 | 15 288 736 | 31 719 424 | 100 |
| 0-4 | 1 327 638 | 1 250 818 | 3 248 456 | 11,20 |
| 5-9 | 1 309 927 | 1 241 186 | 2 551 113 | 10,56 |
| 10-14 | 1 369 302 | 1 300 113 | 2 669 415 | 10,24 |
| Children (Total 0-14) | 5 439 488 | 4 784 032 | 10 223 520 | 32,00 |
| 15-19 | 1 463 994 | 1 378 483 | 2 842 477 | 9,28 |
| 20-24 | 1 594 753 | 1 465 165 | 3 059 918 | 8,96 |
| 25-29 | 1 563 835 | 1 394 246 | 2 958 081 | 8,00 |
| 30-34 | 1 308 467 | 1 166 723 | 2 475 190 | 7,36 |
| 35-39 | 1 053 759 | 960 059 | 2 013 818 | 6,32 |
| 40-44 | 934 835 | 906 811 | 1 841 646 | 6,08 |
| 45-49 | 856 335 | 828 621 | 1 684 956 | 5,36 |
| 50-54 | 770 526 | 720 213 | 1 490 739 | 4,80 |
| 55-59 | 615 538 | 592 805 | 1 208 343 | 4,00 |
| 60-64 | 467 931 | 457 885 | 925 816 | 3,84 |
| Adults (Total 15-64) | 10 404 384 | 9 780 800 | 20 185 184 | 64,00 |
| 65-69 | 327 552 | 331 695 | 659 247 | 1,44 |
| 70-74 | 210 115 | 217 981 | 428 096 | 1,12 |
| 75-79 | 138 582 | 151 744 | 290 326 | 0,40 |
| 80-84 | 66 450 | 79 233 | 145 683 | 0,24 |
| 85-89 | 35 286 | 45 872 | 81 158 | 0,32 |
| 90+ | 19 402 | 23 680 | 43 082 | 0,48 |
| Seniors (Total 65+) | 586 976 | 723 744 | 1 310 720 | 4,00 |
The Malaysian population pyramid, created from the previous data, highlights the discrepancy of men to women. It also shows that Malaysia reached its peaked natality in the early 1990’s. Since then the population has been ageing, as younger generation are now decreasing or stable from the peak of the 20-24 years old generation.
Ethnicity groups of Malaysia
Malaysia is a multi-ethnic society with a majority of “Bumiputera”, ethnies originally from the Malaysian peninsula and Borneo. Bumiputeras are primarily made up of Muslim Malays who represent about 50.7% of the population and other Bumiputeras, made up of various Austronesian ethnic groups representing about 12% of the population.
Malaysia is also home to large minorities of Chinese (21.8%) and Indians (6.6%) with others Malaysians from European and Arabic origins representing a fraction of the population (0.9%). An estimated 2.4 million migrant workers (about 8%), especially working in labor-intensive industries, concentrate in Malaysian Borneo and large urban areas.
The following table sums up the ethnicity of the Malaysian population in the different states and territories, in estimations as of 2015.
Ethnic groups in Malaysian states in 2015
| States | Total | Malay | Others Bumiputera | Chinese | Indians | Others | Non-Malaysian Citizens |
| MALAYSIA | 30,485,200 | 15,479,600 | 3,672,400 | 6,642,000 | 2,012,600 | 267,400 | 2,411,400 |
| JOHOR | 3,553,600 | 1,893,100 | 60,900 | 1,075,100 | 230,700 | 16,900 | 276,900 |
| KEDAH | 2,071,900 | 1,569,100 | 5,300 | 263,200 | 143,200 | 19,600 | 71,500 |
| KELANTAN | 1,718,200 | 1,585,900 | 20,900 | 54,400 | 4,800 | 11,500 | 40,700 |
| MALACCA | 872,900 | 552,700 | 11,500 | 215,000 | 51,400 | 4,800 | 37,600 |
| NEGERI SEMBILAN | 1,098,400 | 621,900 | 20,700 | 234,300 | 154,000 | 4,200 | 63,300 |
| PAHANG | 1,623,200 | 1,146,000 | 83,800 | 241,600 | 66,300 | 7,800 | 77,700 |
| PENANG | 1,663,000 | 692,400 | 7,000 | 689,600 | 166,000 | 4,700 | 103,300 |
| PERAK | 2,477,700 | 1,314,400 | 72,300 | 713,000 | 293,300 | 10,500 | 74,200 |
| PERLIS | 246,000 | 210,200 | 1,200 | 19,200 | 3,100 | 4,700 | 7,500 |
| SELANGOR | 5,874,100 | 3,069,100 | 77,500 | 1,499,400 | 712,000 | 41,400 | 474,700 |
| TERENGGANU | 1,153,500 | 1,092,200 | 3,500 | 27,700 | 3,000 | 2,500 | 24,600 |
| SABAH | 3,543,500 | 268,500 | 1,968,100 | 311,500 | 12,200 | 112,700 | 870,400 |
| SARAWAK | 2,636,000 | 616,900 | 1,276,300 | 602,700 | 7,900 | 8,900 | 123,300 |
| KUALA LUMPUR | 1,768,000 | 729,500 | 21,500 | 684,100 | 163,000 | 15,200 | 154,700 |
| LABUAN | 96,800 | 33,900 | 40,900 | 10,700 | 800 | 1,700 | 8,800 |
| PUTRAJAYA | 88,300 | 83,800 | 900 | 500 | 900 | 100 | 2,100 |
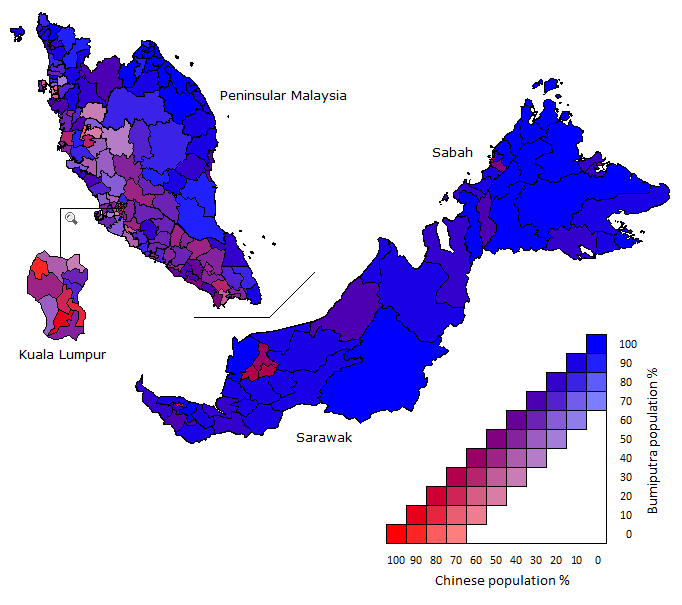
To illustrate further the geographic distribution of the population, the following map shows the prevalence of the two major ethnic groups in Malaysia. It highlights the percentage of each ethnic group, Bumiputera and Chinese, in the different regions of Malaysia in 2008.
Languages in Malaysia
Though Malaysians have speakers of many local and foreign languages, the official language is Bahasa Malaysia. However, since English has been an administrative language of Malaysia during the colonial period, it remains an active second language in many areas of Malaysian society. It is taught in public schools as a compulsory subject and is used by many businesses.
Chinese Malaysians often speak Chinese dialects from the southern provinces of China, such as Cantonese, Mandarin, Hokkien, Hakka, Hainanese, and Fuzhou. Tamil is often used by Malaysian Indians who are primarily of Tamil origin.
Religions in Malaysia
Islam is the state religion of Malaysia but religious freedom is guaranteed by the constitution. According to the 2010 census figures, ethnicity and religious beliefs are highly correlated and the religions in Malaysia were practiced in the following proportions:
- 61.3% Islam (primarily Sunni Islam)
- 19.8% Buddhism
- 9.2% Christianity
- 6.3% Hinduism
- 1.3% Confucianism, Taoism and other traditional Chinese religions
- 0.7% declared no religion
- 1.4% other religions or no information
The advanced connectivity of Malaysians
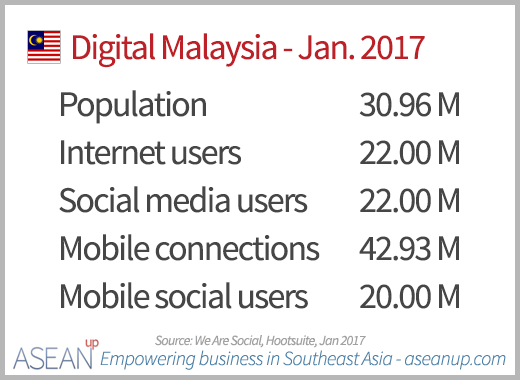
With a high penetration of Internet, Malaysia is one of the most connected countries in Southeast Asia. Its population is well versed in the use of digital technologies and social media, and can therefore be reached through PCs or mobiles devices more easily than in other ASEAN countries.
This is an important dimension to take into account for anyone marketing in the traditional digital services such as travel, e-commerce or finance.
Income of Malaysians
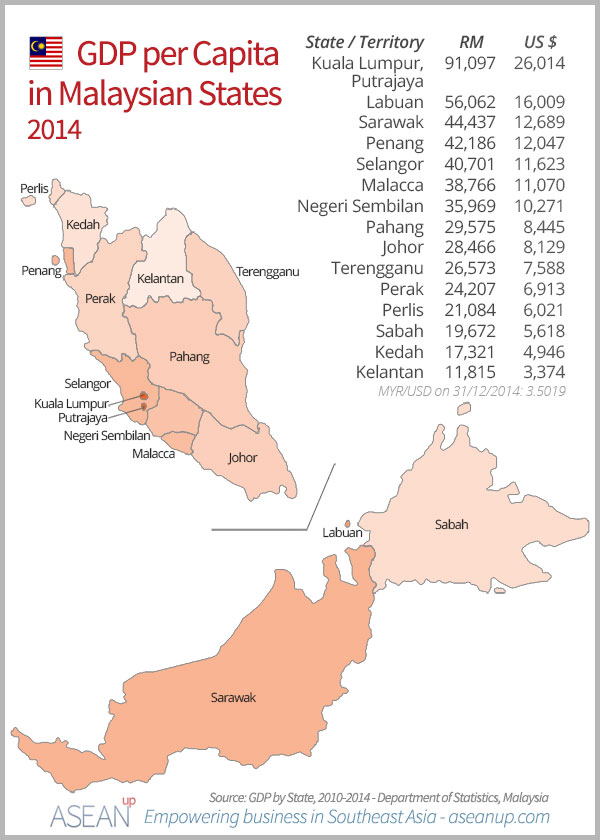
According to the International Monetary Fund, Malaysia had a nominal GDP of 375.6 Billion US $ in 2014. Reported to its population, Malaysia is thus a middle income country with a GDP per capita of 12,127 US $.
However, in Purchasing Power Parity, this figure is much higher at 25,833 US $ per person, due to the relatively lower cost of living in Malaysia. The standard of living is therefore much higher than the nominal figure would let us think.
Inequalities of revenue between states and territories
Nevertheless, the revenue of Malaysians, expressed in GDP per capita, shows vast territorial inequalities. According to the Department of Statistics of Malaysia, the GDP per capita in Kuala Lumpur reached the levels of developed countries at 26,014 US $, but stretched as low as 3,374 US $ in the states with less revenues, such as Kelantan.
Consumption of Malaysians
Key data into the mind, tastes and habits of Malaysians for all marketers, here is some more information on consumption from the Malaysian department of statistics. This will provide great insights on how much Malaysian consume and what part of their income they devote to specific types of products and services.
Consumption in urban versus rural Malaysia
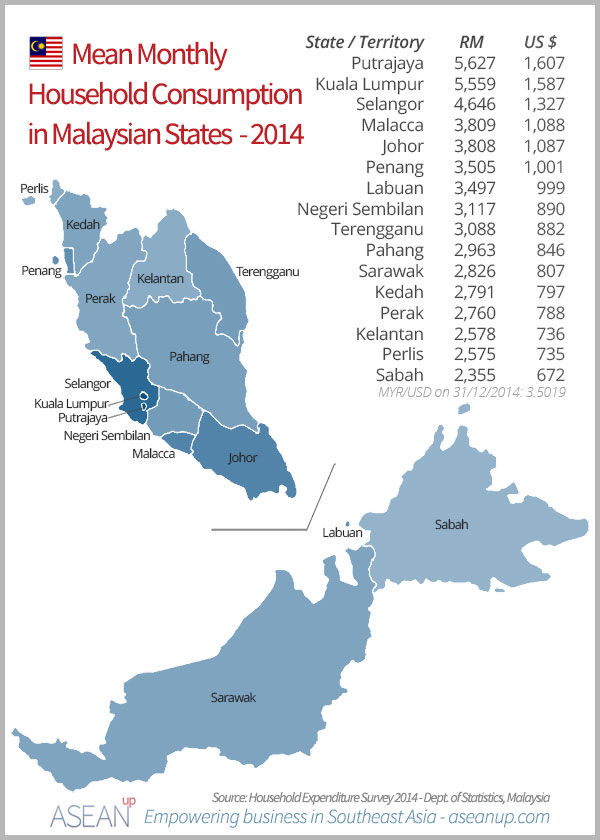
As incomes vary between states and rural or urban Malaysians, so does their consumption. The following data presents the differences in monthly household consumption expenditure between rural and urban Malaysia and their evolution over 5 years between 2009 and 2014.
Mean monthly household consumption expenditure
| Year | 2009 | 2014 | Annual compound growth 2009/2014 |
| Malaysia | 2,190 RM 625 US $ | 3,578 RM 1,022 US $ | 9.8% |
| Urban | 2,465 RM 704 US $ | 3,921 RM 1,120 US $ | 9.3% |
| Rural | 1,599 RM 457 US $ | 2,431 RM 694 US $ | 8.4% |
MYR/USD rate on 31/12/2014: 3.5019
Consumption disparities between Malaysian states
Income inequalities between the different states and territories in Malaysia obviously generate disparities in household consumption. Four states show a mean monthly household expenditure above the country’s average 3,578 RM (1,022 US $): Putrajaya (5,627 RM – 1,607 US $), Kuala Lumpur (5,559 RM – 1,587 US $), Selangor (4,646 RM – 1,327 US $) and Malacca (3,809 RM – 1,088 US $).
Composition of household expenditure in Malaysia
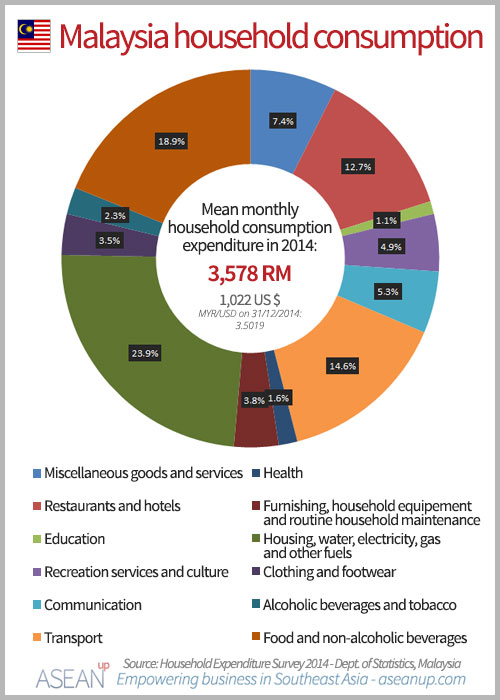
This last diagram summarizes the composition of the mean monthly household expenditures in Malaysia in 2014. This key for marketing in Malaysia notably highlights the weight of certain key expenses in the household consumption:
- Housing, water, electricity, gas and other fuels: 23.9%
- Food and non-alcoholic beverages: 18.9%
- Transport: 14.6%
- Restaurants and hotels: 12.7%



![Insights and trends of e-commerce in Malaysia [market analysis] e-commerce in Malaysia](https://aseanup.com/wp-content/uploads/2017/02/Malaysia-e-commerce-150x68.jpg)
